


Currency Arbitrage Explained
Introduction
Recently, while trading, I noticed a price difference for the same stock between the National Stock Exchange (NSE) and the Bombay Stock Exchange (BSE). This made me think: why not buy the stock on the cheaper exchange and sell it on the more expensive one? However, I soon discovered that India's market regulator, SEBI, prohibits buying and selling the same stock on different exchanges within the same day. With this strategy ruled out, I began to explore a similar approach with foreign stocks.
Imagine a stock listed on both the New York Stock Exchange (NYSE) and the NSE. Suppose the stock is priced at $100 on the NYSE and ₹7,500 on the NSE. Given an exchange rate of $1 = ₹80, the NYSE price converts to ₹8,000. By purchasing the stock on the NSE for ₹7,500 and selling it on the NYSE for ₹8,000, there's a potential profit of ₹500.
This strategy, known as arbitrage, takes advantage of price differences of similar assets across markets.
Currency markets are ideal for finding arbitrage opportunities due to the many currency pairs available for trading. For example, if you convert EUR to USD, USD to GBP, and then GBP back to EUR, and end up with more EUR than you started with, you've identified an arbitrage opportunity. This happens when the sequence of conversions results in a more favorable rate than a direct conversion.
Modeling Currency Markets with Graphs
To understand currency exchanges, imagine visualizing the market as a directed graph. In this graph, each currency is represented as a vertex, and each exchange rate between currencies is depicted as an edge connecting these vertices. For instance, converting 1 EUR to 1.12 USD or 1 USD to 0.76 GBP can be seen as edges in this graph. This visual representation helps us trace paths between currencies and evaluate potential profitability based on the rates.
Graph Theory and the Bellman-Ford Algorithm
To identify arbitrage opportunities, we need to delve into graph theory, specifically the Bellman-Ford algorithm. This algorithm finds the shortest path from a single source vertex to all other vertices in a weighted directed graph. After running Bellman-Ford, each vertex is labeled with the total weight of the shortest path from the source.
Once the shortest paths are established, the algorithm checks all edges to see if any further reduce the path weight. If any edges can still be "relaxed," it indicates a negative-weight cycle. In graph theory, a negative-weight cycle is a path where the total weight decreases with each loop, meaning the shortest path isn’t well-defined because the path can be indefinitely reduced.
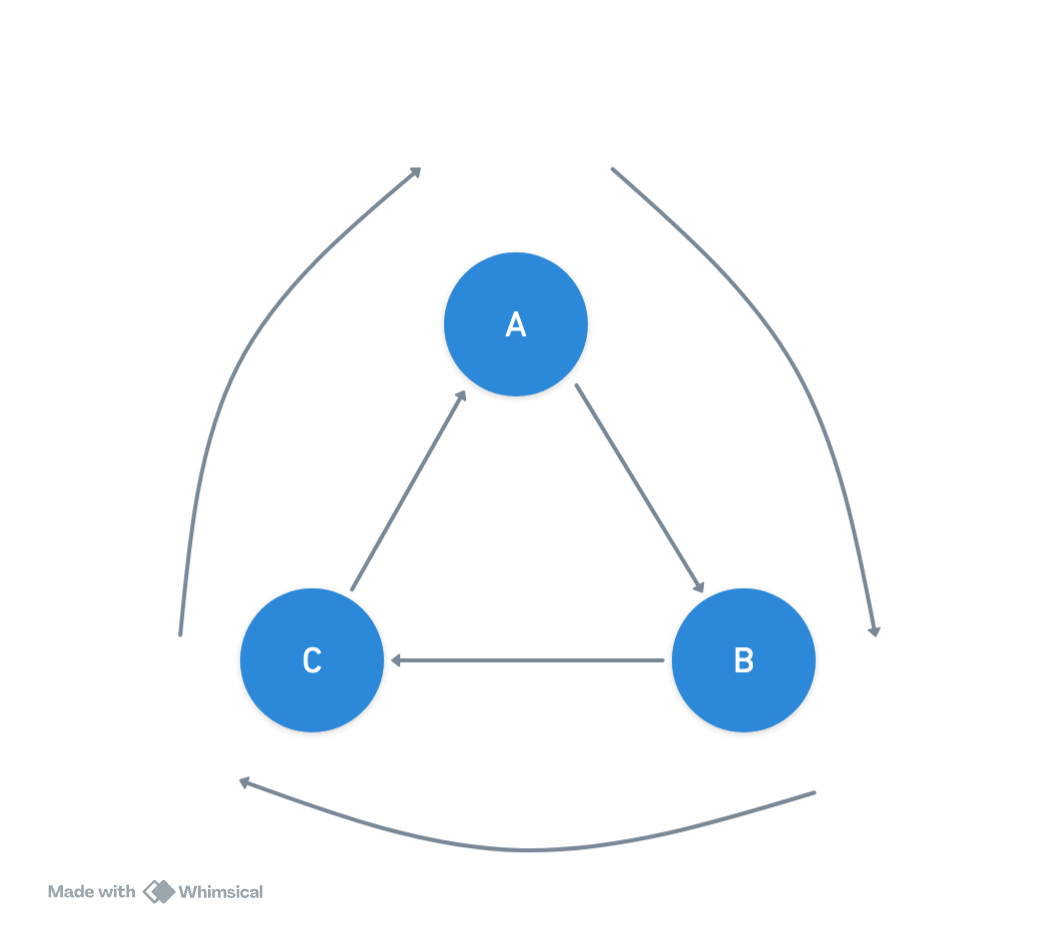
Consider trying to determine the shortest path from vertex A to vertex B in the graph below. Initially, the direct path from A to B has a weight of 5.5. However, if we explore alternative routes, such as A → B → C → A → B, we find that this route has a total weight of 4. Repeating this cycle further reduces the weight, demonstrating the effect of a negative-weight cycle.
Consequently, the shortest path from A to B becomes undefined because its weight can be continually minimized, reflecting the inherent problem with negative-weight cycles in pathfinding algorithms.
 The Bellman-Ford algorithm is particularly suited for this task because it can detect such negative-weight cycles, revealing profitable arbitrage opportunities that other algorithms, like Dijkstra’s, may miss.
Once the shortest paths are established, the algorithm checks all edges to see if any further reduce the path weight. If any edges can still be "relaxed," it indicates a negative-weight cycle. In graph theory, a negative-weight cycle is a path where the total weight decreases with each loop, meaning the shortest path isn’t well-defined because the path can be indefinitely reduced.
Consider trying to determine the shortest path from vertex A to vertex B in the graph below. Initially, the direct path from A to B has a weight of 5.5. However, if we explore alternative routes, such as A → B → C → A → B, we find that this route has a total weight of 4. Repeating this cycle further reduces the weight, demonstrating the effect of a negative-weight cycle.
Consequently, the shortest path from A to B becomes undefined because its weight can be continually minimized, reflecting the inherent problem with negative-weight cycles in pathfinding algorithms.
Detecting Arbitrage with Bellman-Ford in Currency Markets
Having explored how the Bellman-Ford algorithm detects negative-weight cycles, let's apply this method to uncover arbitrage opportunities in currency markets. In our currency graph, each edge represents an exchange rate between currencies. To identify profitable paths, we need to detect cycles where the product of exchange rates exceeds 1.
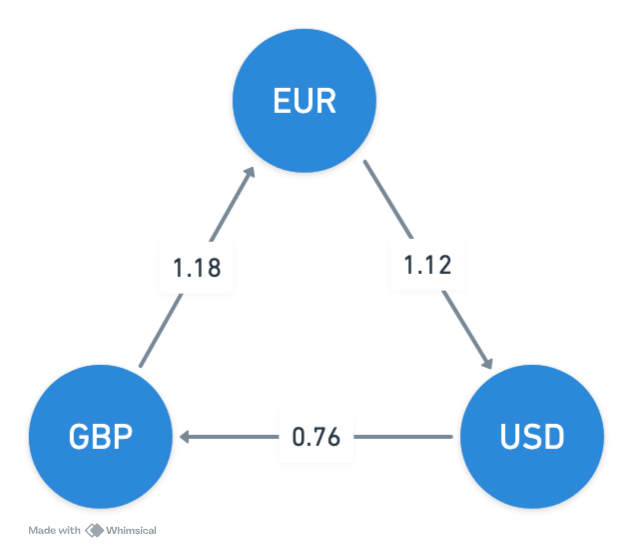
For example, consider converting 1 EUR through the sequence EUR → USD → GBP → EUR. If this round trip results in more EUR than we started with, it indicates a potential arbitrage opportunity. Suppose the exchange rates are:
1 EUR = 1.12 USD
1 USD = 0.76 GBP
1 GBP = 1.18 EUR
The product of these rates is
1.12 × 0.76 × 1.18 ≈ 1.004416
If converting 1 EUR yields more than 1 EUR in this cycle, we have found an arbitrage opportunity.
To formalize this, we detect a cycle in the graph where the product of all edge weights (exchange rates) is greater than 1. Practically, this involves two adjustments to the Bellman-Ford algorithm:
- Log Transformation: Since exchange rates are multiplicative, we take the logarithm of each edge weight. Summing these log-transformed weights allows us to work with additive values. We recover the product of rates by exponentiating the sum.
- Inverting Weights: Bellman-Ford finds minimum weight paths, but for maximizing exchange rates, we need to work with negative log weights. Thus, we use the negative of the log-transformed weights.
Conclusion
In summary, arbitrage presents a unique opportunity to profit from price discrepancies across different markets, whether in stocks or currencies.